- OptimistiCallie
- Posts
- 🚑 Denominator blindness
Hey hey, happy Monday.
First, check out my latest piece in Business Insider on why people are so confident about the stock market – and how that confidence may be crossing the line into an arrogance that ultimately makes markets vulnerable. One of my most popular OptimistiCallie posts year-to-date is about this too. Come for the analysis, stay for the rizz.
Today, a 4-minute read on why people are so blind when it comes to context. Or, alternatively, why I’m not freaking out about $1.2 trillion in credit card debt like much of the world is.
Smash the button below to share OptimistiCallie with a friend 😊
There’s a dangerous disease spreading on Wall Street.
One that causes people to overlook what's clearly in front of them.
You know somebody’s been struck when you see them posting incomprehensible rants about a debt crisis or a frothy stock market.
It’s not the flu, although that seems to be making the rounds these days too.
Much worse, actually. It’s denominator blindness (dun dun dun!).
The disease of taking big numbers at face value instead of considering them in context.
Look, we love numbers here at OptimistiCallie. Data don’t lie, which is why we lean so heavily into facts and figures.
But even numbers can mislead you if you don’t view them in terms of risk—the ‘r-word’ we hear all the time but struggle to define.
Take the most egregious example of denominator blindness in the economy right now: credit card debt.
Every quarter, the New York Fed (or you know, the Yankees-loving arm of interest rate nerds) releases a slate of data on the financial health of Americans. And every quarter, like clockwork, the media publishes scary headlines on the trillion-dollar mountain of credit card debt outstanding. Then, social media slips into a doom spiral and you get tweets like this:

That chart probably makes you cringe, which is fair. $1 trillion is a lot of money. All on credit cards, which are considered one of the more irresponsible financial inventions of the 20th century.
Surely, this means our friends and family are drowning in unnecessary debt, lured by the capitalism machine and influencer links. Oh, and that the US economy is doomed.
Not so, my friend. Call the ambulance, because you’ve fallen ill to denominator blindness.
Any self-respecting analyst will tell you that you can’t look at debt levels in a vacuum. Debt must be compared to the person’s ability to service the debt. Otherwise, it’s just a number.
Think of it this way. You have a friend who’s a millionaire and makes high six figures a year in income. Would you chastise him for his financial irresponsibility if he took out a $50K loan for a new, flashy Porsche?
Of course you wouldn’t. You know he has the means to pay the loan off quickly. Plus, friends don’t judge friends for using debt strategically.
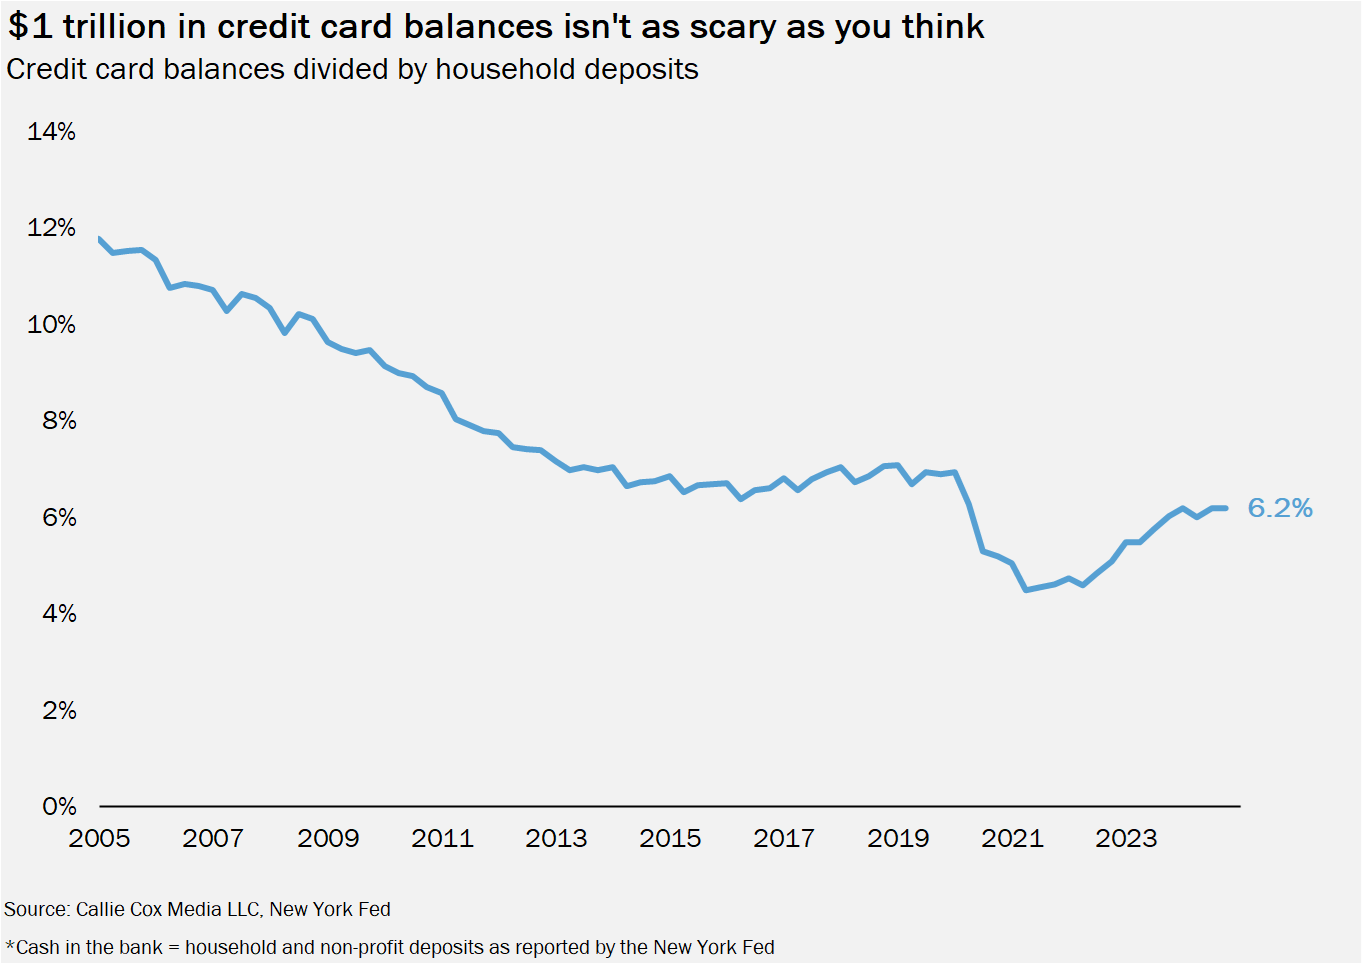
Why would you do the same for your fellow Americans? Compare that $1.2 trillion in credit card debt to total money in the bank and you’ll see it’s hardly at concerning levels:
If your response to this is that the richest people are skewing the overall data, then I’ll raise you this chart: total assets (cash, stocks, business ownership) divided by total debt, excluding real estate and mortgages.
The most context-laden view you can get in public data.

I excluded the top 1% because frankly, their A/L ratio skewed the chart too much.
American households across income classes are in a historically strong position to pay off their debt, even when you exclude home equity (which is high because of how insane the housing market is).
Yes, people are struggling in this environment. Yes, affordability and income inequality are a problem. No, $1 trillion in credit card debt will not single-handedly crash the economy.
All of these statements can be true.
This same disease has spread into the stock market’s metrics, too.
Look at this chart of the S&P 500’s price-earnings ratio, a measure of where a stock or index is trading relative to the profits it’s expected to generate over the next year.
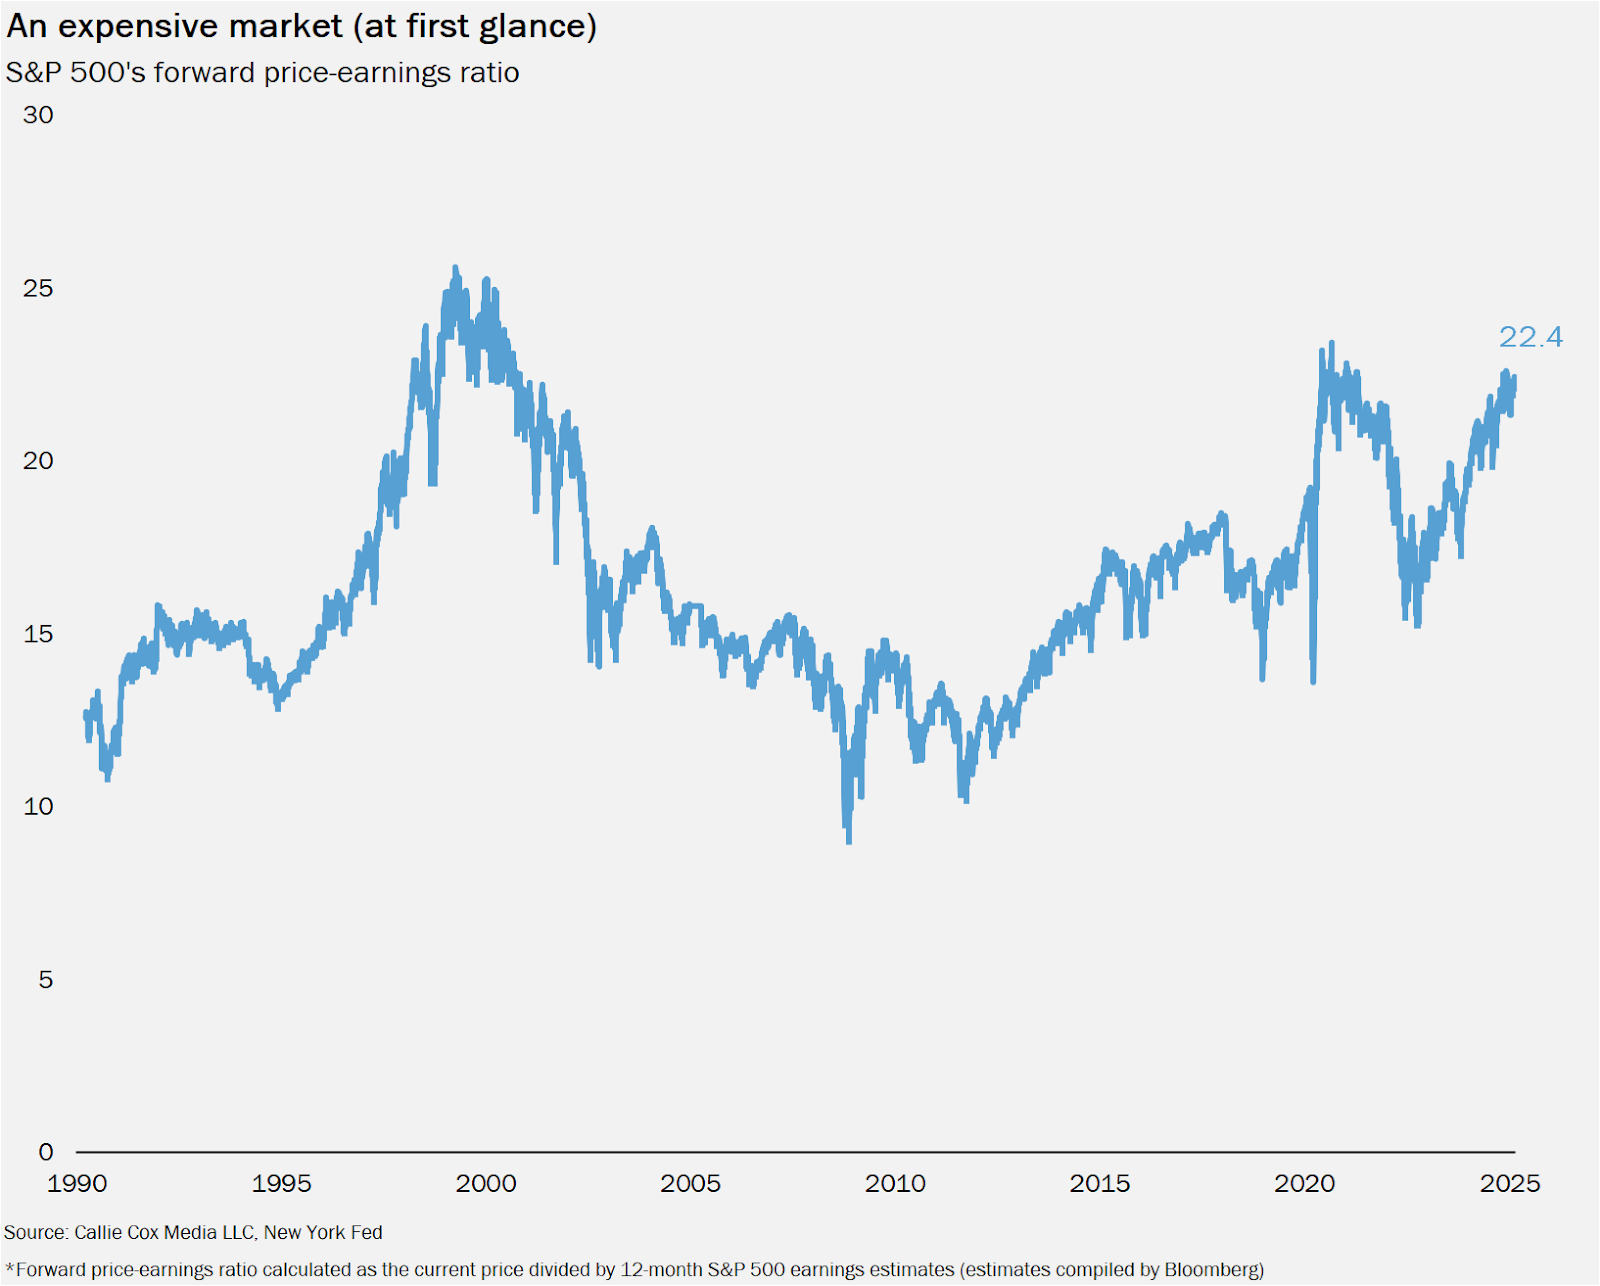
A higher PE ratio shows prices are unmoored from earnings, and a sky-high PE ratio was a warning sign before tech stocks imploded in the dot-com bubble days.
So as you can imagine, people are freaking out over the PE ratio right now because it’s nearing a two-decade high. The highest since…the late 1990s.
But to judge a market based on its PE ratio is to be blind to crucial information that could actually determine the future path of prices.
Because like credit card balances, rising PEs alone aren’t a good reason to panic. You need to look at the P (price) and the E (earnings) separately. You know, the numerator and that pesky little denominator we all like to ignore.
In this instance, the P is clearly growing. We’re coming off two back-to-back 20% years for the S&P 500. Investors are assigning a higher value to the future today than two years ago.
And for good reason, because the E is growing too. S&P 500 earnings have increased for five straight quarters, and analysts expect profits to keep growing at a double-digit rate this year. In fact, Wall Street has grossly underestimated profit growth the past several quarters, which has led to the E growing faster than everybody expected.
Nevertheless, when earnings are growing, you have to be skeptical of the PE ratio’s dubious signals. Because when profits are rising, people understandably feel good about the future, and the stock market often deserves a higher price.
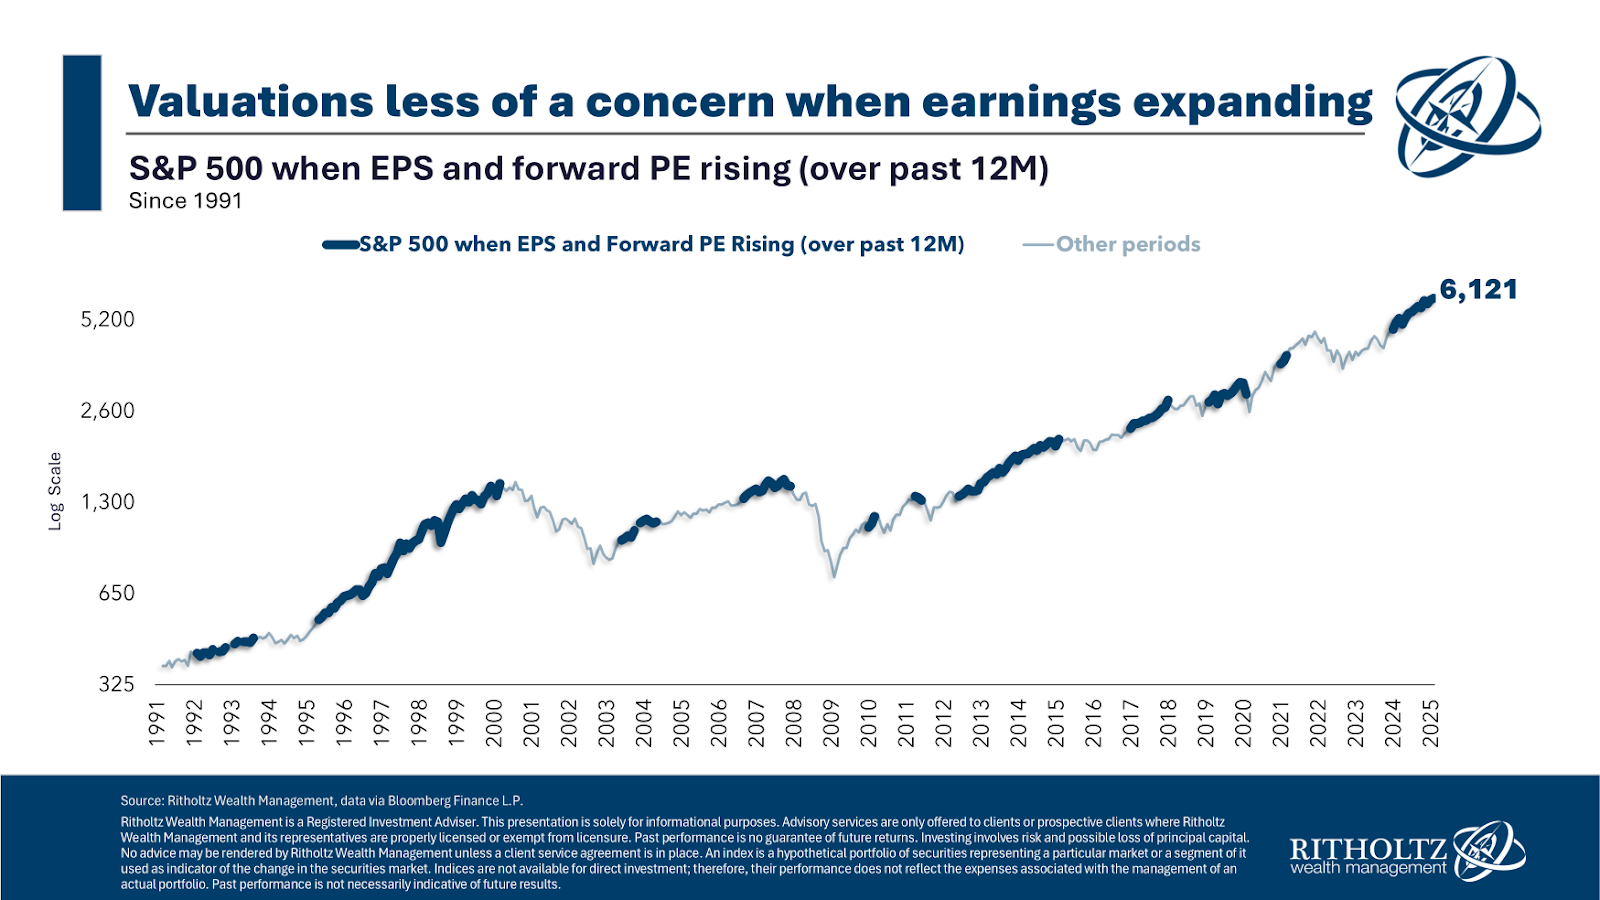
This is why you often see the PE ratio rise at the beginning of strong market rallies (or bull markets, as Wall Street says) then fall later on. Prices rocket higher as the mood recovers, yet earnings often take a few quarters to recover.
It’s sick season, and the germs can be hard to dodge. You’ll see symptoms of context-starved panic in government debt, the CAPE ratio and student loan balances too.
Talk to your doctor about how you can protect yourself from denominator blindness.
Or, you know, just keep reading OptimistiCallie. I’ll help you out with that.
Thanks for reading!
Callie
Like what you just read? Share it with a friend, pretty please 😊