- OptimistiCallie
- Posts
- ⌛Precedent in the unprecedented
Hey hey, happy Monday.
Yes, things feel crazy right now. Yes, I have thoughts on why the economy is in a much more precarious position than people think. You can watch my conversation with my buddy Josh Brown on this very topic, and I’ll probably have more to say in the coming days.
For now, I want to teach you about the worst stains on Wall Street. The biggest stock market crashes in history. What we can learn from our darkest days, because history’s lessons are what’s getting me through all of this craziness.
This is a longer post (a 10-minute read if you’re down for an adventure) but I’m hoping it’s one you’ll save and come back to when you need it.
Smash the button below to share OptimistiCallie with a friend 😊
I’m a market history nerd.
Like, a really big market history nerd.
I have a massive spreadsheet of every bear market going back to 1900, with way too many details on how big each drop was, what was going on at the time and how long it took to recover. It’s one of my most valuable possessions as an analyst, and I’ve kept it through 11 years on Wall Street and several different roles.
The only thing missing is what can’t fit neatly into Excel: the feeling of the world falling apart, over and over again. For that, we have books, memories and collective trauma.
When things feel chaotic, I lean on numbers, analogies and patterns.
So as you can imagine, I’ve been struck by how little precedent there is for what we’re seeing today. A loss of confidence, a panic about grocery prices, a fear of important institutions breaking down.
I suppose you could draw a few parallels between now and 2011 when the S&P 500 dropped almost 20% on the back of a global debt scare. Maybe Watergate. Still, this isn’t your run-of-the-mill economic downturn, and social media alone makes this moment feel even more perilous.
But a few days ago, I had a thought after scouring through lines of data:
There is precedent in the unprecedented.
We may not have exactly been here before, but we sure as hell have felt this way.
1929-1932: The Great Depression
Size of S&P 500 crash: -86%
Length of crash: 2.7 years
Time to recover losses: 22 years (the longest recovery in history)
Economic crisis? Yes (the worst in history)
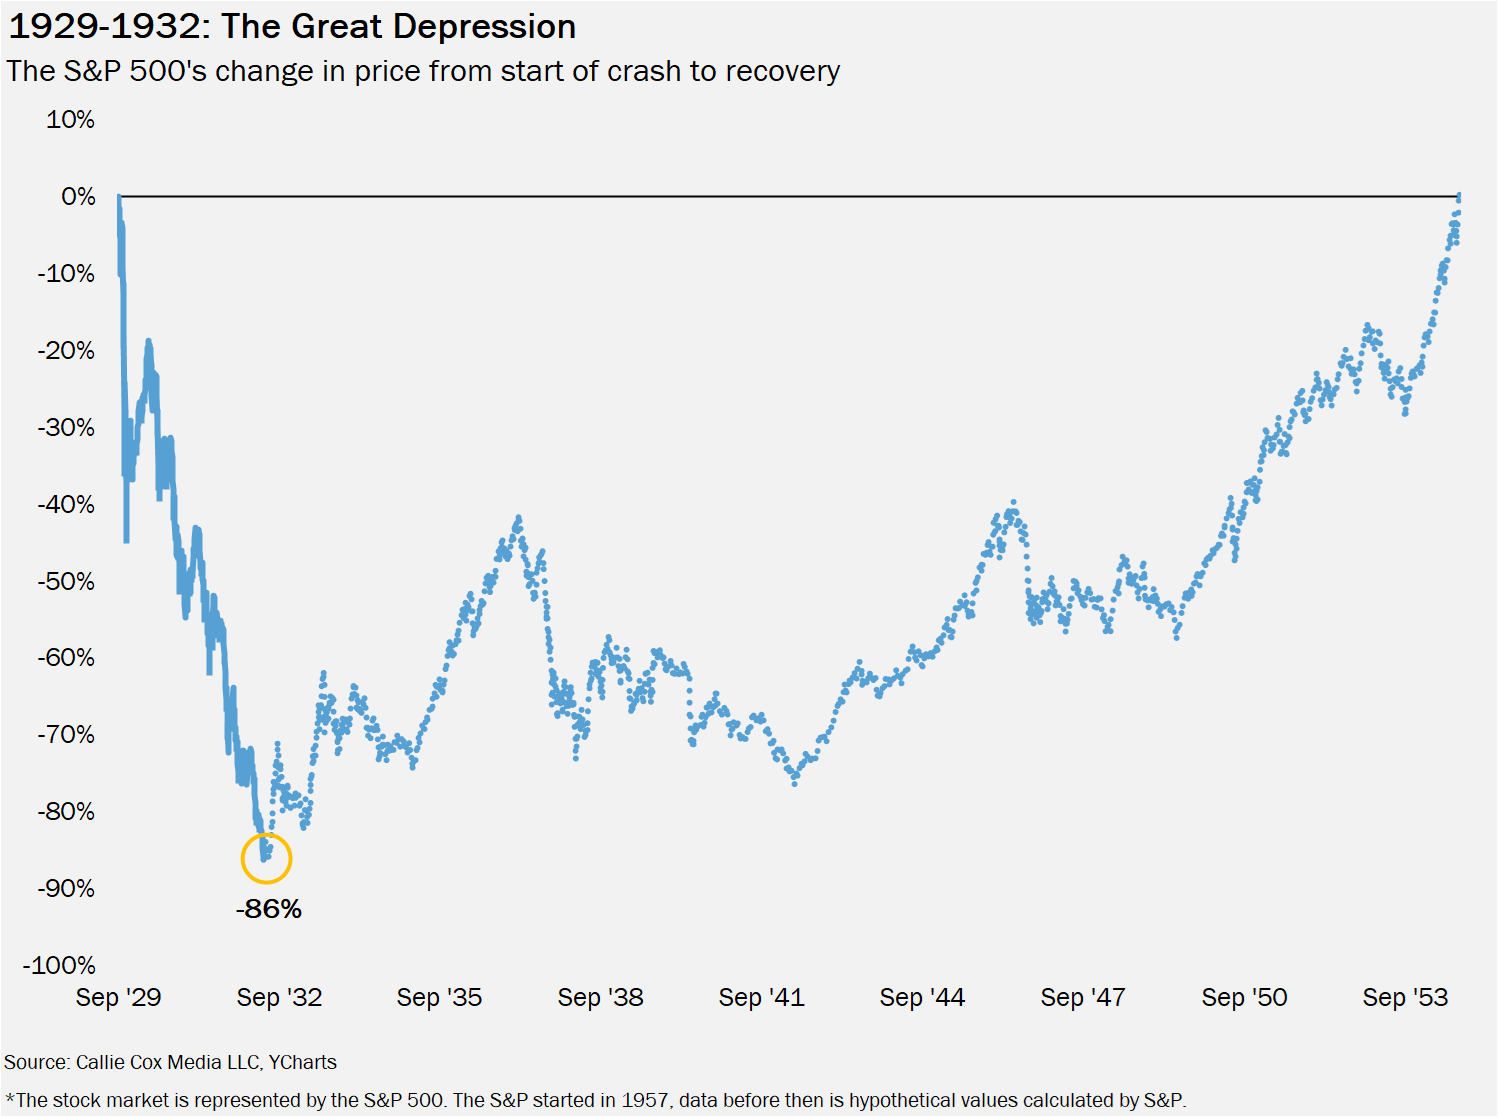
What happened: When market historians talk about the worst periods in history, they often rank the Great Depression at the top of the list…and for good reason. The Great Depression was a nasty combination of bank panics, the deterioration of the gold standard, and pure excess from the Roaring 20s. One in five people lost their jobs, and the economy shrank by nearly 30%. The damage was so vast that the stock market didn’t recover for two decades.
What pulled us out of this deep ditch? A pause, a few deep breaths, and policy. Back then, there weren’t as many tools to restore confidence in the financial system and the bank runs were crushing the economy. In response, new President Franklin D. Roosevelt called for a week-long bank holiday in March 1933 to pause the panic and allow Treasury and Fed officials to make a plan. An extreme idea, but desperate times call for desperate measures.
How we got out of it: The plan worked. Congress passed the Emergency Banking Act, which allowed banks to re-open in stages and increased the Federal Reserve’s authority over the banking system. Yes, interest rate nerds existed back then, too.
Withdrawals turned to deposits as confidence came back. The stock market jumped 15% the day banks opened up. Roosevelt’s New Deal programs established industry-specific agencies (like the SEC and FDIC) to promote fair competition, boosted employment through targeted programs and created social safety nets for the unemployed and elderly.
1938-1942: A crisis within a crisis
Size of S&P 500 crash: -46%
Length of crash: 3.5 years (the longest crash in history)
Time to recover losses: 2.8 years
Economic crisis? Yes

What happened: This crash is often overshadowed by the Great Depression, and understandably so. But it was a distinct phase of pain for investors. After the market reached new 52-week highs – a nice victory after a devastating fall – stocks went on to endure a 48% drop over three and a half years. Yes, that’s three and a half years of watching your portfolio slowly get cut in half.
The US economy was bouncing back after the Great Depression, with unemployment falling to 11% in late 1937. President Roosevelt got a little too cocky and celebrated victory by cutting back on government spending. On top of that, the Fed effectively cut the money supply by building back reserves. Officials simply let their foot off the brake too soon.
How we got out of it: Ironically, World War II may have been what ultimately pulled the US economy out of its decade-long malaise. Manufacturing activity soared and unemployment plunged as factories ramped up production of wartime materials and vehicles. Innovations like radar technology (for microwaves), penicillin and the personal computer came out of this stressful time, and Americans banded together to support the troops overseas.
1973-1974: Watergate & the oil shock
Size of S&P 500 crash: -48%
Length of crash: 1.7 years
Time to recover losses: 5.8 years (the longest recovery since the Great Depression)
Economic crisis? Yes
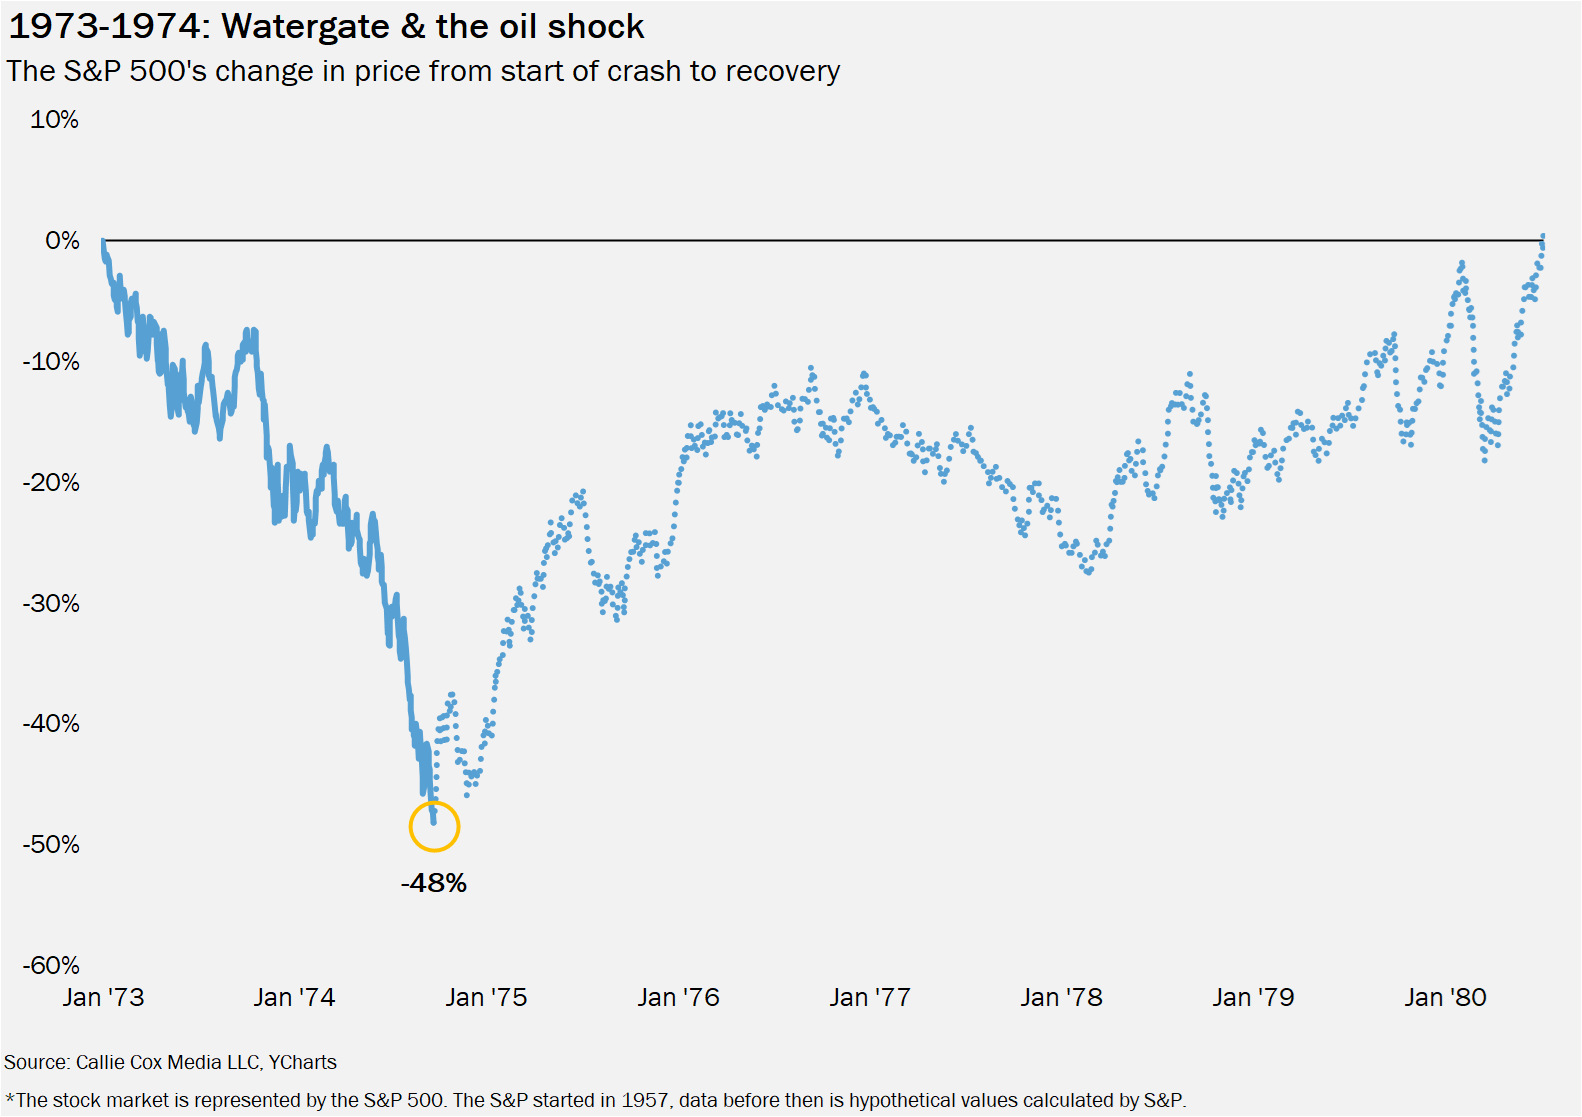
What happened: In the 1970s, the US was haunted by a number of loosely related forces that led to higher prices – most notably, oil prices. In 1973, the Organization of Arab Petroleum Exporting Countries (OAPEC) enacted an oil embargo on the US, preventing imports from a bloc of countries that accounted for half of the world’s oil production.
Oil prices quadrupled to $11/barrel, and stayed high even after the embargo was lifted the next year. Inflation measured by the Consumer Price Index climbed as high as 12% per year, and the economy lost its footing. When people talk about stagflation, they often harken back to this specific moment in history.
The Watergate scandal was also underway around this time, adding a layer of political chaos to an already strenuous period. The timing was uncanny. The stock market started sliding right before President Richard Nixon’s trial began, and ended just after his resignation. The S&P 500 fell 12% alone in the three months between Nixon’s impeachment and last day in office.
How we got out of it: The oil shock and Watergate scandal were a fever that the U.S. economy just had to sweat out. Oil prices eventually came down, cooling inflation and easing pressures on our wallets. Tax cuts and credits in 1975 also helped boost spending among individuals and businesses.
America encountered another oil shock in the late 1970s, and Fed chair Paul Volcker ultimately quashed stagflation in the 1980s with one of the steepest interest rate increases in history. Fed policy went through an important transformation in this era, as it began publishing inflation and unemployment targets and considering both long-term and short-term goals for the economy.
Nerdy, but necessary, because the new approach to policy ushered in a golden decade for the economy in the 1990s.
1987: Black Monday
Size of S&P 500 crash: -34% (with much of it happening in one day)
Length of crash: 3 months
Time to recover losses: 1.6 years
Economic crisis? No
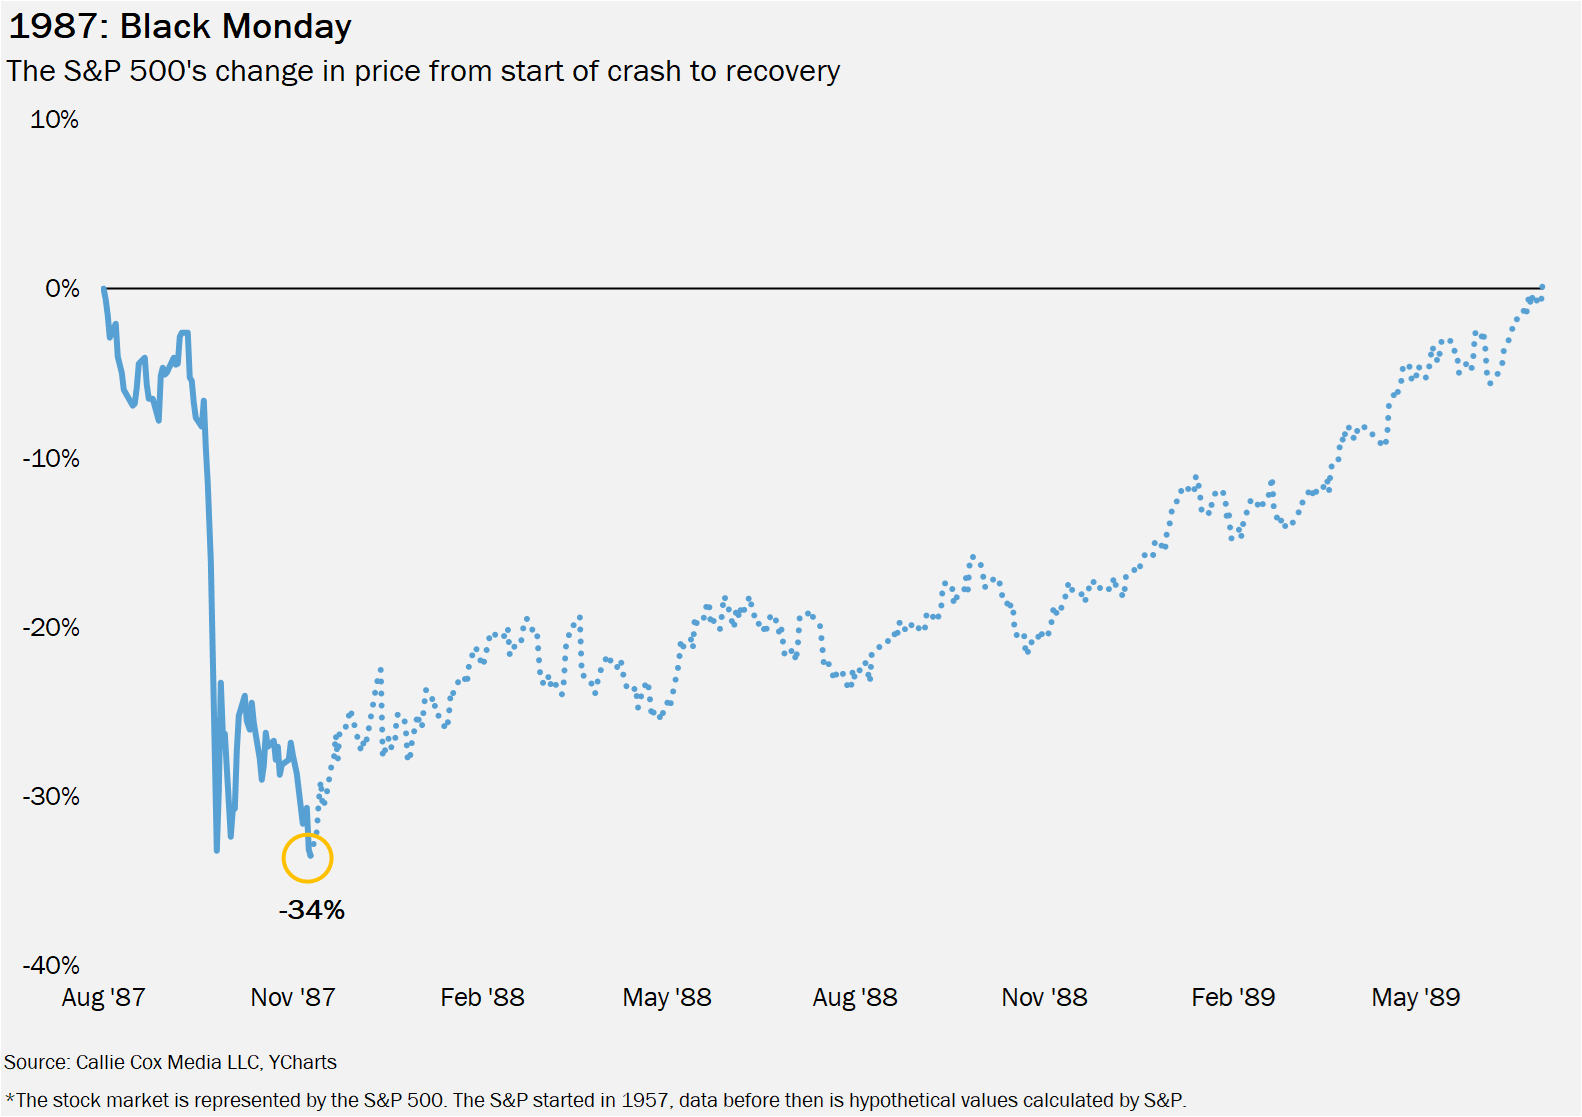
What happened: With a name like Black Monday, you know it was dark. On October 19, 1987, the S&P 500 dropped 21% – the worst one-day decline in history – as worries about the U.S. trade deficit and dollar sparked a tidal wave of selling that spread from overseas to the U.S. It was the first financial crisis in modern history, in that it was fueled by lightning fast selling and the domino effect from complex financial products. Luckily, banks kept lending through the panic, and the economy wasn’t devastated by a drastic swing in market confidence.
But the scars – and the legacy – of this frightening day lingered for decades. A stock market crash that happened in a matter of hours.
How we got out of it: The day after Black Monday, Fed chair Alan Greenspan published a comment saying that the Fed would be willing to change policy to help support the financial system. The stock market recovered over half of its Black Monday losses in just two days. A few days later, the Fed made good on its promise by cutting interest rates, and exchanges enacted a set of important rules and stopgaps that would allow for trading pauses in the event of another panic.
Since then, we’ve only endured one trading day – March 16, 2020 – with losses even half as bad as Black Monday.
2000-2002: The dot-com crisis/September 11 terrorist attack
Size of S&P 500 crash: -49%
Length of crash: 2.5 years
Time to recover losses: 4.6 years
Economic crisis? Yes
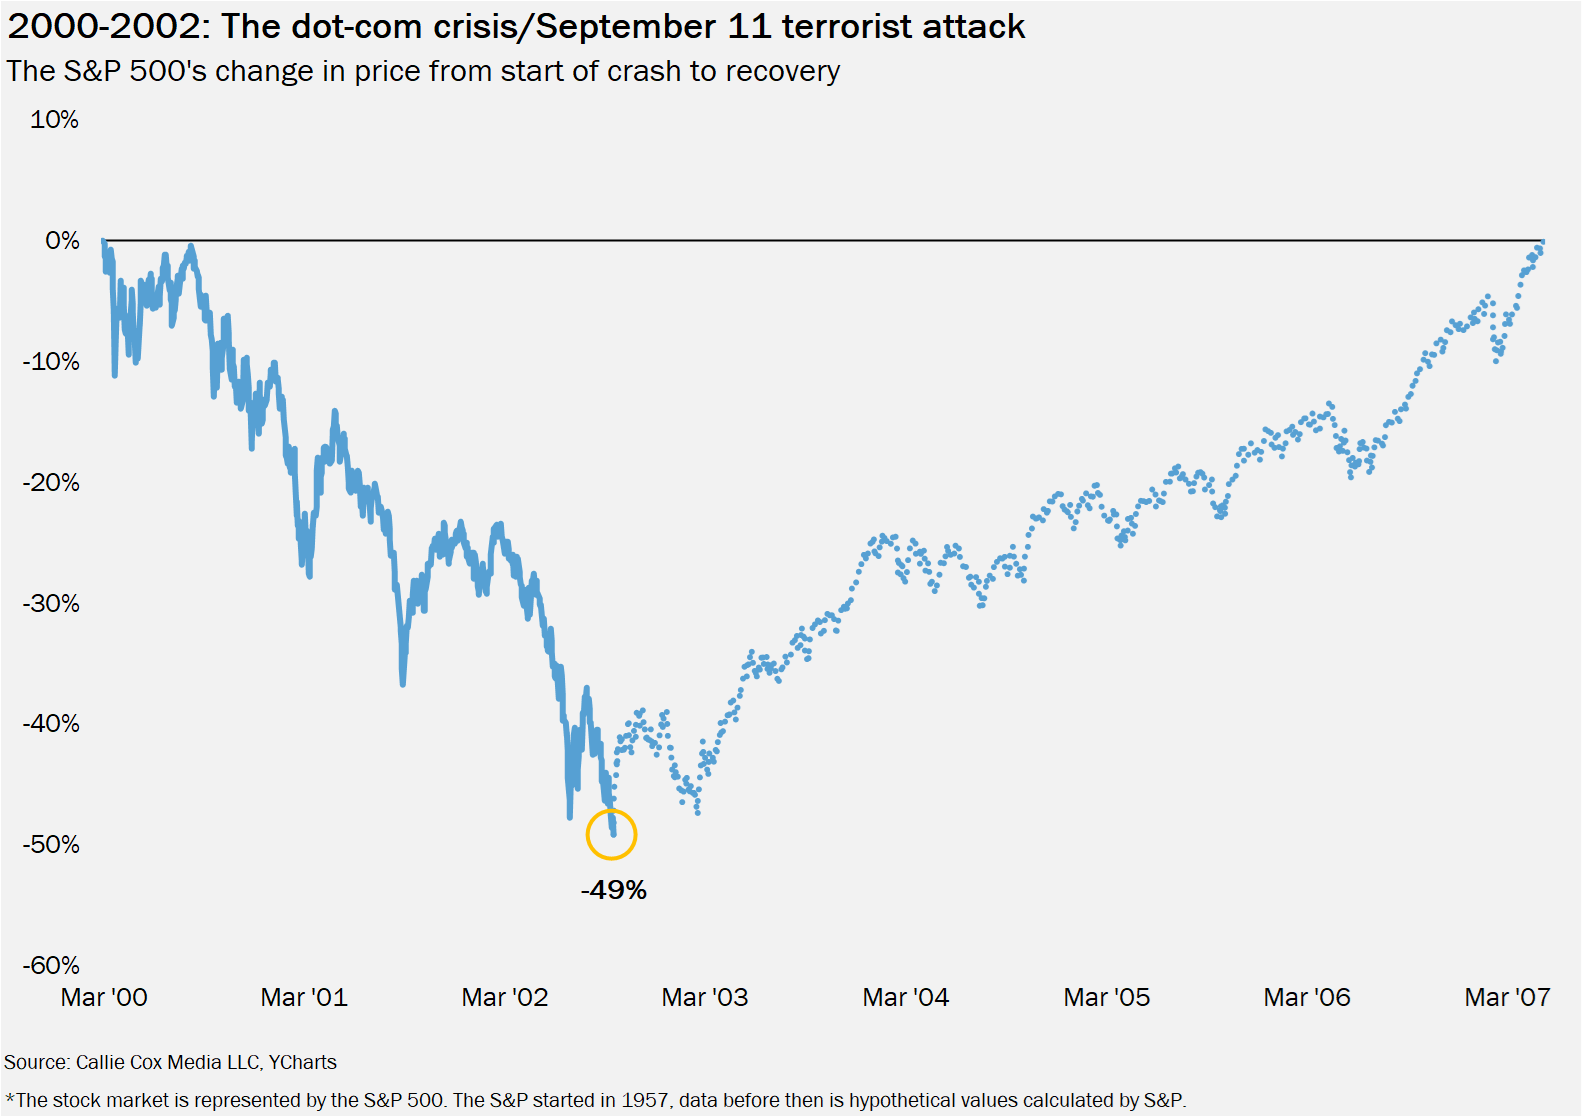
What happened: Ah, the dot-com crisis. The pinnacle of excess.
In the 1990s, the unemployment rate went straight down, corporate profits went straight up, and inflation stayed in check. We were blessed with the advent of AIM, Napster and electronic mail. It was an exciting time, yet the excitement turned into a frenzy.
People started buying any stock with dot com in the name. Y2K forced a mass stockpiling of hardware and software and then…it was all just noise. Suddenly, tech stocks had gone too far, and investors started to realize it in March 2000. A selloff turned into a panic, and the tech-heavy Nasdaq 100 plunged 83% in two and a half years.
September 11 accelerated a crisis already in motion. Of course, 9/11 was a national tragedy that sent the U.S. into a period of mourning, but it also led to a big drop in business and consumer spending.
How we got out of it: The Fed played a big role, cutting interest rates by five percentage points to stimulate spending and borrowing. And at a point, tech stocks just…stopped falling. The crash exhausted itself, and the weight of 9/11 slowly dissipated.
When people talk about market manias, the dot-com crisis is usually the first to come up. What people tend to forget, though, is that the idea of the internet wasn’t wrong. It was just early. Early is wrong in portfolio terms, but the dramatic market losses weren’t necessarily a condemnation of progress. The internet ended up revolutionizing the world. A few years later, its broader use cases became clear, and a wide swath of companies ended up profiting handsomely.
2007-2009: The global financial crisis (aka the Great Recession)
Size of S&P 500 crash: -57%
Length of crash: 2.5 years (longest since World War II)
Time to recover losses: 4.6 years
Economic crisis? Yes (the worst since the Great Depression)
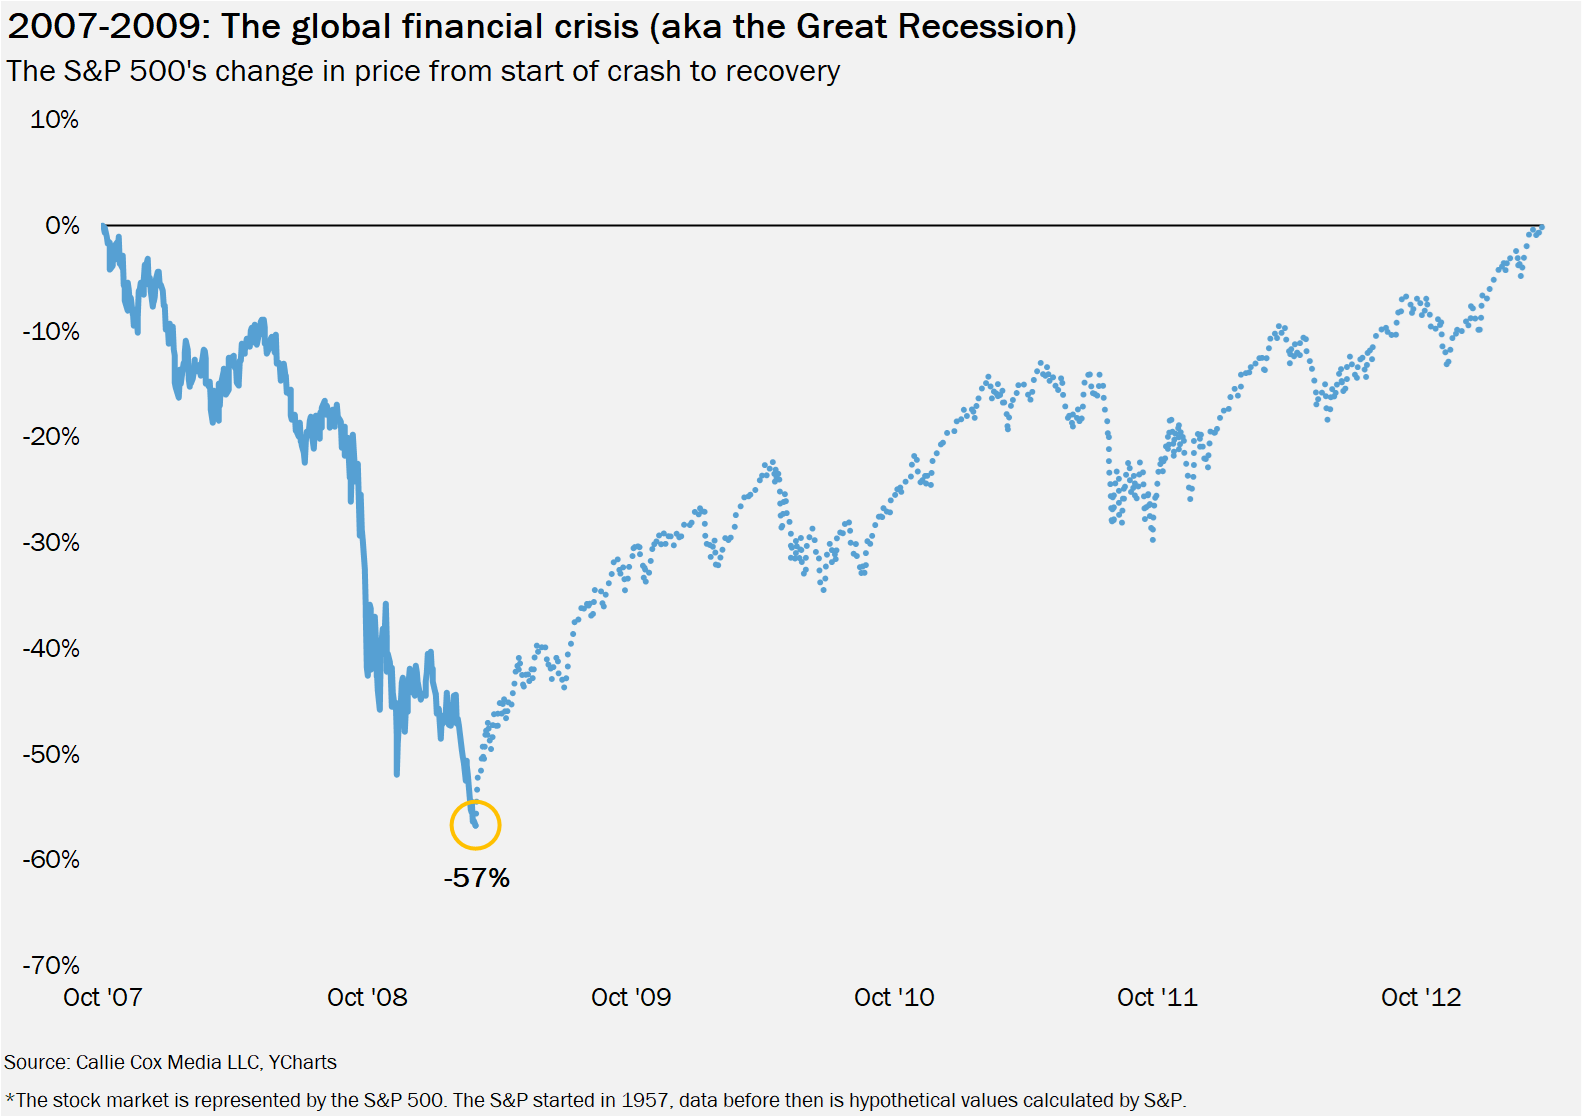
What happened: Once the Fed cut rates down to nearly zero after the dot-com crisis, Americans began to gorge on adjustable-rate mortgages and debt – and banks were happy to oblige. At first, the early 2000s seemed to be the beginning of another prosperous era for the economy. Home prices soared, and Wall Street schemed up new ways to allow people to tap their home equity and effectively bet on the health of the housing market. The entire U.S. financial system became intertwined with the housing market.
It all worked…until it didn’t. The Fed, concerned about the froth and speculation in the economy, started gradually raising rates in late 2004, eventually forcing adjustable-rate mortgage payments higher. Mortgage delinquencies and foreclosures jumped, and banks’ balance sheets crumbled as housing-related financial instruments plunged. Wall Street effectively brought down the entire U.S. economy.
How we got out of it: New policy, and lots of it. The Fed cut rates to zero throughout the crisis and started buying mortgage-backed securities and Treasuries to shore up investor confidence. Congress passed the American Recovery and Reinvestment Act in February 2009 to stimulate spending across the economy. Congress then authorized Treasury to buy billions in troubled debt (the notorious “bank bailouts”) to support markets via the Emergency Economic Stabilization Act and provided another billion-sized injection to the flailing auto industry.
The global financial crisis was the most painful downtown since the Great Depression. At its peak, one in 10 working-age Americans had lost their job, and one in 10 homeowners had fallen delinquent on their mortgage. Yet from all that pain, we gained a stronger banking system, a sturdier foundation for fixed-income markets, and a new approach to policy that set the table for a decade-long stock market rally.
2020: The COVID crisis
Size of S&P 500 crash: -34%
Length of crash: 1 month (the swiftest crash in history)
Time to recover losses: 5 months
Economic crisis? Yes

What happened: Chances are you remember these days all too well. COVID spread rapidly across the U.S. in the early days of 2020, forcing governments to close down public spaces and enact mask mandates to slow the spread and support the health system.
In financial terms, the economy slammed on the brakes, then gradually came back online. Of course, this threw the stock market into one of the quickest crashes in history and broke business models across industries. The S&P 500 fell 33% in just over a month, including a 10% drop in seven hours on March 16, 2020.
It was a frightening time. We were worried about our money, our jobs and our public safety. Heck, we were washing groceries and sanitizing our hands until our skin cracked and bled.
How we got out of it: Policy changes, mask mandates, and the miracle of modern medicine.
The stock market found its footing quickly because of the quick response from Fed nerds and politicians. The Fed cut rates to zero within a week of the economy shutting down, and Congress implemented programs including checks and loans worth trillions of dollars. In November 2020, Pfizer and Moderna announced they had created vaccines effective against COVID, and these vaccines were rolled out to the public over months. Yes, variants emerged, but the mortality of COVID dropped, and the pressure on the health system eased over time.
COVID had disastrous impacts on society – impacts that we’re still learning about today – yet it led to a renaissance of sorts for science and technology. COVID unearthed the need for stronger supply chains, better work-from-home setups, new outdoor digs for homes and restaurants, and a thirst for a quality of life we didn’t know we needed. That, and Americans took the time spent inside to dream up a new life for themselves. Applications for new businesses nearly doubled from 2019 to 2020, and they’re still historically high.
COVID was my first market crash as a full-blown adult in the finance industry. I remember strings of days when I was so stressed from everything that I could barely focus. Walks outside were about all we could do to de-stress. Cities turned into ghost towns and the news was plastered in surging death tolls and health care workers covered in gear.
And yet…here we are. The carousel kept spinning, and stock prices kept rising.
I don’t want to minimize fears over what’s happening right now, or what has happened in the past. I’d be lying if I said I wasn’t anxious about the future.
But when my mind starts to wander, I try to center it on this:
Over the past 70 years, we've endured wars, recessions, political turmoil, financial crises, health crises, humanitarian crises, 13 recessions and 11 bear markets. Still, over that timeframe, U.S. stocks have delivered ~8% average annual returns.
Look. It's not easy. I'll still be here trying to logic out a bunch of illogical forces we're all processing together.
But if you take anything from history, let it be this:
You – and your portfolio – are much more resilient than you think.
Thanks for reading!
Callie
Like what you just read? Share it with a friend, pretty please 😊